(Work in progress)
Indications for Use
The Gluroo Digital Diabetes Solution (“Gluroo”) is a companion secondary display application indicated as an aid in the management of diabetes. Gluroo is intended to provide a secondary display of continuous glucose monitoring (CGM) and/or insulin pump data on a consumer electronic device. The software provides for electronic download of blood glucose and CGM data, insulin pump data, manual data entry, storage, display, communication, transfer, and aiding in the understanding of blood glucose and other related health indicators which can be shown in report and graphical format. It is intended to be used by users of blood glucose monitoring devices and their care team to keep a log tracking nutrition, exercise, medication, and other data.
Gluroo is not intended for use in the diagnosis of disease.
Gluroo is not intended to replace the real-time display of continuous glucose monitoring and/or insulin pump data on the primary display device. Gluroo is a companion secondary display application. All therapy decisions should only be based on measurements obtained from the first-party approved devices.
Gluroo is not intended for making treatment decisions or recommendations. This device is not intended to replace self-monitoring practices as advised by a physician. Do not alter any treatment plans without consultation with a qualified physician.
Gluroo is not intended for controlling insulin pumps or other drug delivery systems. Gluroo is not intended for calculating insulin or other drug doses. Dosing decisions should not be made based on this device. The user should follow instructions on the continuous glucose monitoring system.
Gluroo is not intended for use by anyone unable to use mobile devices and/or computers proficiently.
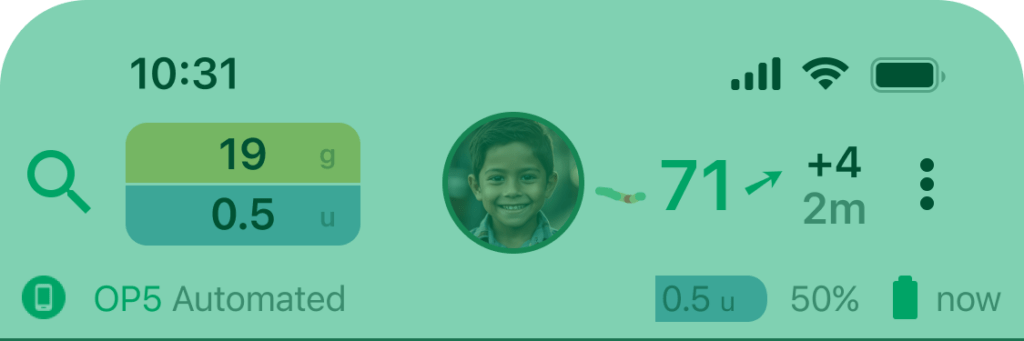
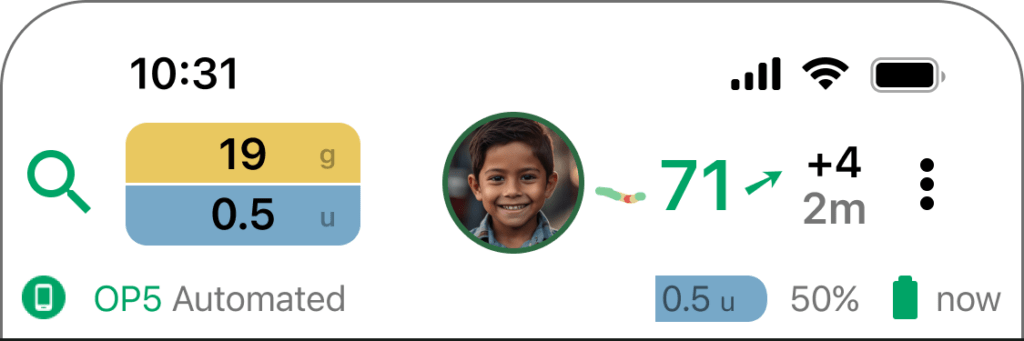
Header
Most recent live data
Drawer
Quick access to more detailed data
Gluroo Event Log (GEL)
GEL is a chat-based log of all diabetes events, newest messages are on the bottom.
Header
Most recent live data

Primary User (formerly Person with Diabetes or PWD)
This profile picture shows you the person whose diabetes data you are currently viewing: the Primary User of the current GluCrew. This is very helpful in the circumstance where you are connected to more than one person with diabetes within Gluroo.
Tap on this to:
Switch to a different GluCrew (if you are helping multiple Primary Users)

Blood glucose status
This section of the header allows you to see information about their most recent blood glucose data. Connect a Continuous Glucose Monitor (CGM) to Gluroo to benefit the most from this feature. Finger prick readings will also show here. When a CGM has recently been changed and is warming up, this section will provide that status and estimate the time remaining in the warm up period before readings should resume.
Tap on this to:
See more stats within the “Drawer.”

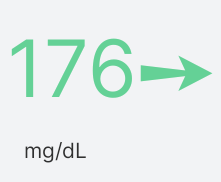
Current value
Primary User’s most recent blood glucose value, reflecting either a CGM reading or glucometer value from a logged fingerprick measurement. The units are either mg/dL or mmol/L as specified under the GluCrew settings.

Trend arrow
This arrow shows the direction and rate of change between the current and previous blood glucose levels from a CGM. It may be missing if the reading is from a glucometer or if the CGM sensor declines to provide a trend arrow.

Amount of change
The top value is the rate of change (in the GluCrew’s BGL units) over the last five minutes. For sensors that report every five minutes, this is simply the prior reading subtracted from the latest reading.
The bottom value is the time since the last reading was received. If the last reading is more than 10 minutes old the current value (to the left, described above) will be crossed out.

Sparkline of last hour+ of readings
A mini-chart that shows the last hour+ of readings at a glance. This helps you see patterns such as “recovering from a low” or “coming down from a high” that the Trend Arrow alone cannot convey.

Carbs on Board (COB)
An estimate of how many grams of carbohydrates remain in the PWD’s body waiting to be digested and absorbed into the bloodstream. When not eating, this number decreases over time, faster for intervention snack sugars and slower for other foods.
Tap on this to see your current onboard calculations within the Drawer.

Insulin On Board (IOB)
An estimate of how many units of insulin remain in the Primary User’s body waiting to be absorbed. When no new bolus insulin is taken, this number will decrease over time based on the built-in activity curve for the insulin that was dosed.
For AID (Automated Insulin Delivery) pumps, this IOB section may be split into two numbers showing the Gluroo estimate + a second number that is the additive correction needed to reach the pump-reported IOB. For example, if an OP5 reports 4.9U of IOB and Gluroo’s estimating 2.6U based on the insulin boluses recorded in the GEL, the IOB sections will read “2.6 + 2.3”. The difference in IOB estimates between Gluroo and the OP5 generally come from: 1) differences in activity curves used by the two systems; and 2) (in Automated Mode) small (but sometimes frequent) automatic correction boluses provided by the OP5 that don’t get recorded directly by Gluroo.
Tap on this to see your current onboard calculations within the Drawer.

Search
Button that allows you to search the GEL looking through all previously logged meals, snacks, exercise announcements, device changes, boluses, chat messages, and more.
Tap on this to open the search functionality on the bottom of the Chat area

Menu
Button that allows you to take more actions such as adjusting settings, connecting devices including CGM or pump, inviting people to your GluCrew, managing your Prescription (Carb Ratio [CR], Insulin Sensitivity Factor [ISF], BG Target), and more.
Tap on this to open the menu tray in the Drawer.

Pump connected
Indicates which pump integration is set up and remotely displays notices from the pump when possible (the whole section is missing if the PWD does not have a pump configured)

Pump operating mode and notices
Displays the operating mode of the Primary User’s pump followed by any notices the pump integration provides Gluroo. For example, the Omnipod 5 has three modes: automated, limited, and manual.
Pump-reported IOB
The Insulin On Board reported directly by the pump integration. Some pump integrations (for example, DIY Loop) will also have a corresponding goldenrod COB to the left of this display. For AID systems, the IOB can generally be thought of as the insulin on board in excess of the standard basal. E.g., if an AID system increased the basal rate, the pump-reported IOB may go up even without a meal bolus being given or recorded.

Battery level and status
This is the last reported battery charge remaining on the Primary User’s phone and/or PDM for their pump. The battery icon will also be a charging icon if and only if the Primary User’s phone is plugged in and charging. Gluroo also provides notifications to the rest of the GluCrew if it’s late at night and their phone has low battery left and is not charging.

Time status of last device update
Shows how much time has passed since the last updated status from the Primary User’s phone and/or PDM. The device display area will fade as the data is older to alert you to stale data.
Drawer
Quick access to multiple tabs of more detailed data.
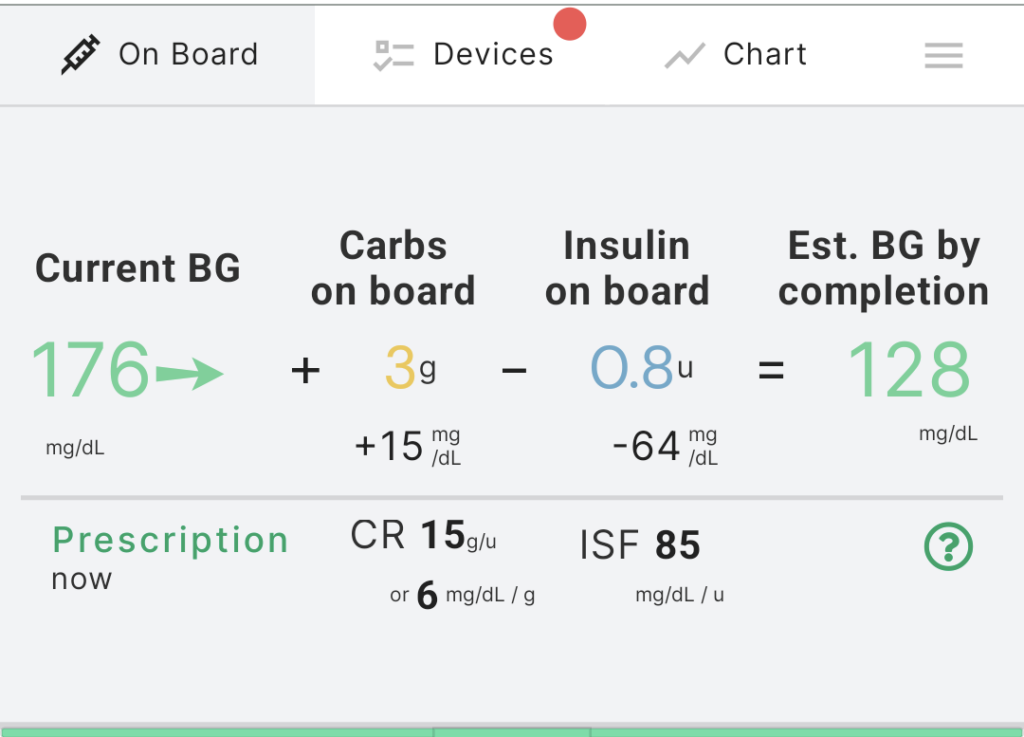
On Board
This Tab shows you a standard calculation that estimates what the Primary User’s blood glucose level will be once the insulin and carbohydrates already recorded are fully absorbed.
You will only see this calculation when there is an active Prescription for the Primary User providing their Carb Ratio and Insulin Sensitivity Factors.
The blood glucose levels are expressed in either mg/dL or mmol/L. You can choose the preferred units for a GluCrew under GluCrew Settings.
Current BG
Current blood glucose level, reported by a recent CGM or finger-prick glucometer reading. This number should be crossed-out or missing if the reading is not up to date. You must always confirm BG readings using the 1st party app (e.g., Dexcom G6 or G7 app) directly connected to the CGM or from an approved glucometer’s on-device screen. Gluroo is not for making medical decisions.
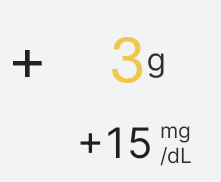
Carbs on Board may increase BG
A simple calculation of how much to expect the Primary User’s BG to rise based on their estimated COB and their Carb Ratio (CR) from the current prescription for the current time of day. See also the COB in the header.
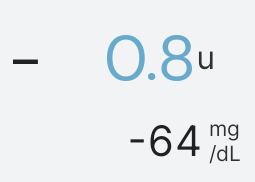
Insulin on Board may decrease BG
A simple calculation of how much to expect the Primary User’s BG to fall based on their estimated IOB and their Insulin Sensitivity Factor (ISF) from the current prescription for the current time of day. See also the IOB in the header.
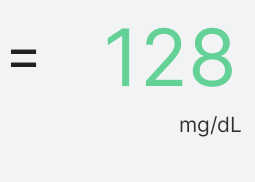
Estimated BG by Completion
A simple calculation of the current BG plus the calculated increase due to COB and minus the expected decrease due to IOB. The estimate can be wrong due to any number of factors including incomplete logging, inaccurate estimation of COB or IOB remaining, or incorrect or outdated Carb Ratio (CR) or Insulin Sensitivity Factor (ISF).
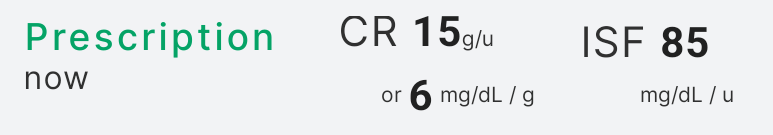
Prescription values for CR and ISF
This bottom section shows the entered prescription values for the current moment in time (in the case of time-of-day splits in the Rx settings) for Carb Ratio (CR) and Insulin Sensitivity Factor (ISF). For simplicity and understandability, these numbers are used for the calculation even if the CR and/or ISF are going to change to different values before the COB and IOB have both decayed to 0.
Carb Ratio (CR) is the number of grams of carbohydrates in food eaten that requires 1 Unit of insulin to be covered. A higher Carb Ratio means the Primary User needs less insulin for the same food, and a lower Carb Ratio means they need more insulin
Insulin Sensitivity Factor (ISF) is the estimated drop of BG value for 1 unit of insulin when no carbs are on board. ISF is often used to calculate the “correction” component of an insulin dose when the BG is higher than their target range. The ISF is given in mg/dL/unit if the Primary User uses mg/dL for their readings, or in mmol/L/unit if the they use mmol/L for their readings.
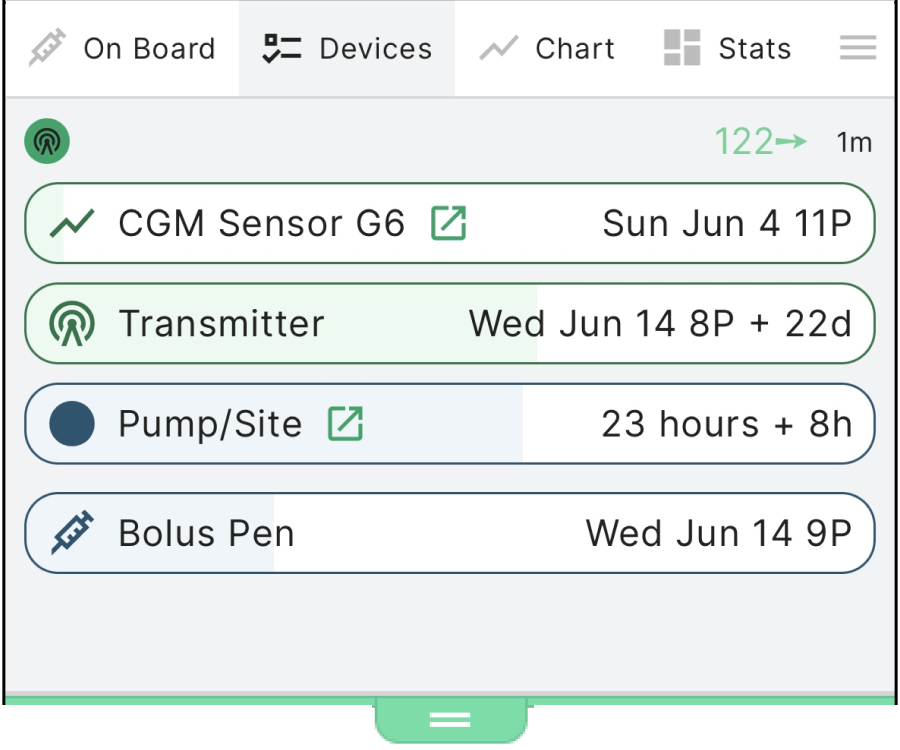
Devices
This Tab shows the devices logged by the GluCrew including CGM sensors, transmitters, pump/pod sites, insulin pens, and more. For devices with QR codes on their packaging, you can log a new device simply by scanning the code from the camera icon at the bottom left of the main screen.
Gluroo uses this information to provide reminders about when devices need to be replaced so you can prepared ahead of time and not be caught off guard.
Each device line item can be tapped to open into more details to include the sensor code and lot number, and for Dexcom sensors there’s a link to make it easy to report a sensor that fails early for them to replace (at their discretion).

CGM indicator
This icon shows that the Primary User has a CGM that is reporting directly to Gluroo (often in addition to also having CGM values read through a follow/share interface). To the right of the indicator, Gluroo may display recent messages on the Primary User’s phone presented by their 1st party CGM app

Device lifespan progress bars
A bar for each device shows a colored background indicating the fraction of the estimated lifespan of the device already passed since logged. For a CGM, it first shows the progression through the warm-up period, and then shows the time left for that sensor session.
You can tap each bar for it to open up more details about the device, and the list of devices can be scrolled if you have more logged active devices than can fit in the drawer’s height.
Device expiration date or time left
The far right of the bar gives an estimate of the expiration date for the device and, as it gets closer to that point in time, provides an estimate of the time left before expiry.
Grace period or uncertainty on time left
If the device has a grace period or some uncertainty to its allowed length, that “extra” possible time is indicated with, e.g., “+ 8h” for an OP5 Pod Pump’s 8 hour grace period. Pictured is a 22 day uncertainty for a Dexcom G6 transmitter’s lifetime (of ~90 days, but often they last 110 days or so).
Always rely on 1st-party apps fro determining device expiries.
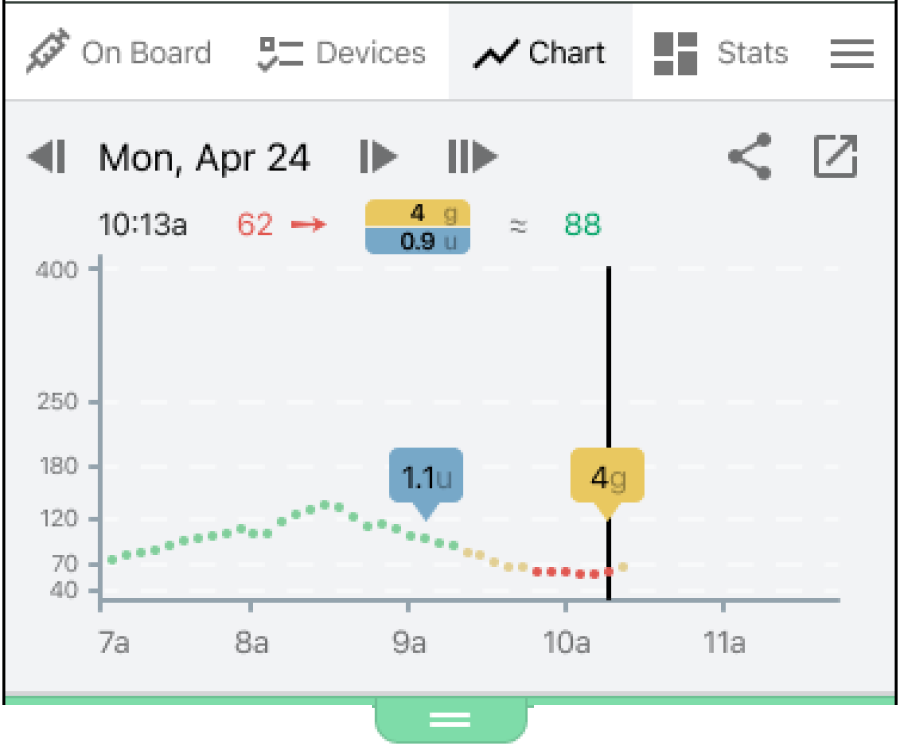
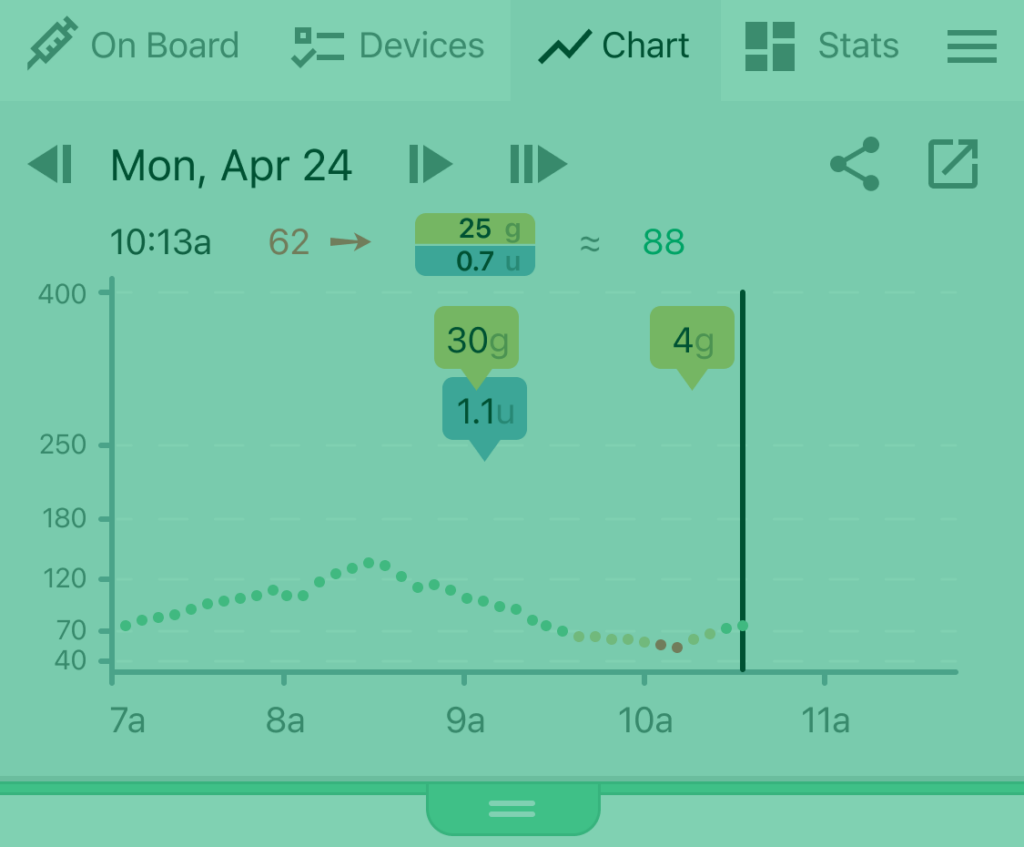
Chart
This Tab shows you the blood glucose level over time with various logged carbs, insulin, device changes, and finger-prick values overlaid on top. The date corresponds to the starting date of the chart, and you can drag the chart left and right to see more data. The arrows adjacent to the date move exactly 1 day backward or forward on a tap, or exactly 1 week backward or forward on a long press. The rightmost arrow jumps forward to the present moment. See also the in-app help description of charts.
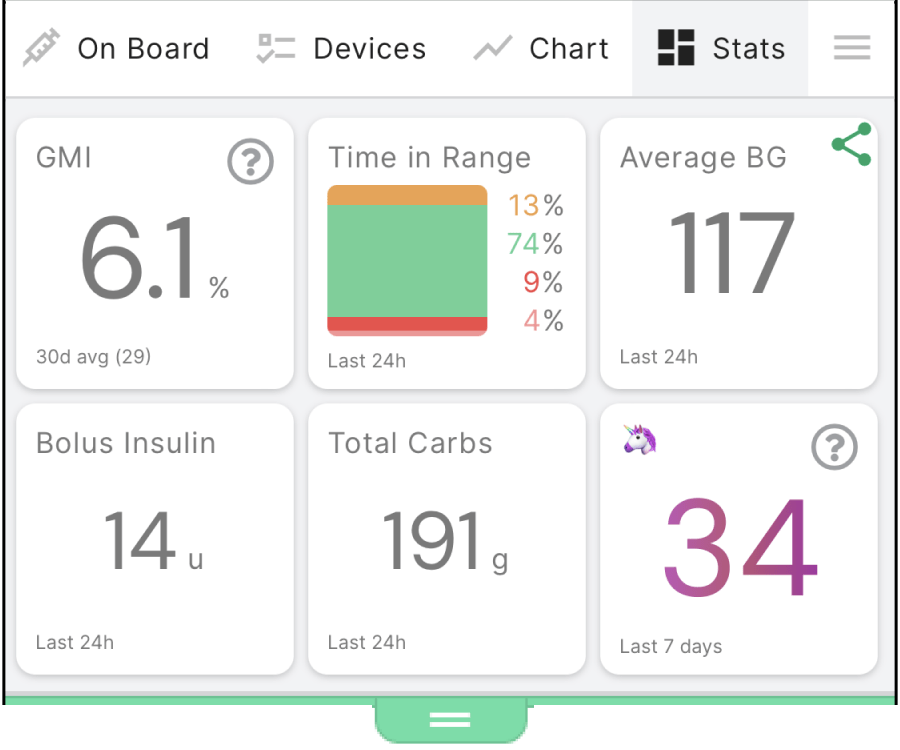
Stats at a glance
Statistics about the diabetes data can show either as a Tab in the Drawer or for some users may show at the bottom of the GEL chat log with a collapsing triangle control.
The statistics can be useful for understanding blood glucose patterns over the last days and weeks to help understand and interpret the Primary User’s diabetes journey and control. Each stat card shows the time range over which it is calculated at the bottom of the card (e.g., 30 days or 24 hours).
Always use statistics supplied by the 1st-party app (e.g., Dexcom for CGM data and the Omnipod App or PDM for pump data) when making medical decisions.
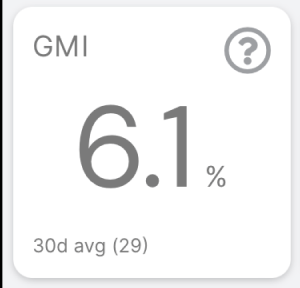
Glucose Management Indicator (GMI)
GMI corresponds to a CGM-driven estimation of the lab measurement for hemoglobin A1C. Gluroo’s GMI calculation takes into account the CGM readings and is updated in real-time helping you understand how tightly controlled the PWD’s blood glucose levels are. Ask your health-care team for advice on your target GMI. The units for GMI and A1C are not the same as your ordinary blood glucose units (even though they are roughly in the same range if your GluCrew uses mmol/L for instantaneous blood glucose readings).
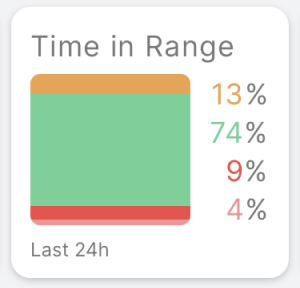
Time in Range (TIR)
This shows the fraction of the time the best available reading was within the target range of 70-180 mg/dL (or about 4.0-10.0 mmol/L). Less than 70 mg/dL (less than 4.0 mmol/L) is considered “Low” (shown in red) and less than 54 mg/dL (less than 3.0 mmol/L) is considered “Very Low” (shown in a different shade of red). Time spent above 180 mg/dL (above 10.0 mmol/L) is considered “High” (shown in orange).
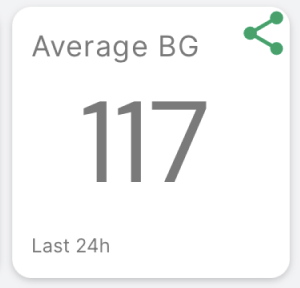
Average BG
This shows an average (arithmetic mean) blood glucose over the displayed time period. Note that logged fingerprick readings will, for 15 minutes, take priority over CGM readings.
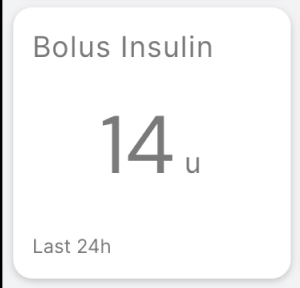
Bolus Insulin
This shows the amount of Bolus (not basal) insulin logged over the displayed time period.
Always use the 1st-party app or PDM’s statistics for making medical decisions (such as updating Carb Ratios or Insulin Sensitivity Factors).
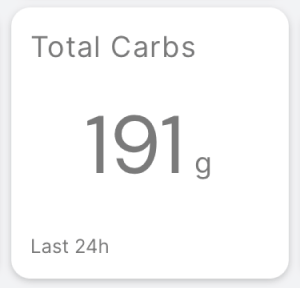
Total Carbs
This shows the amount of carbs logged over the displayed time period.
Always use the 1st-party app or PDM’s statistics for making medical decisions (such as updating Carb Ratios or Insulin Sensitivity Factors).
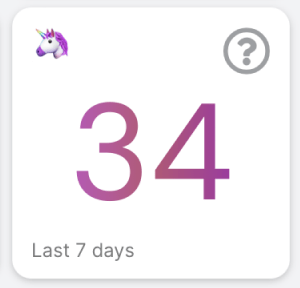
Unicorns caught
This is a mostly-for-fun metric that keeps track of how many times the blood sugar reading from a CGM sensor was reported as exactly 100 mg/dL over the displayed time period.
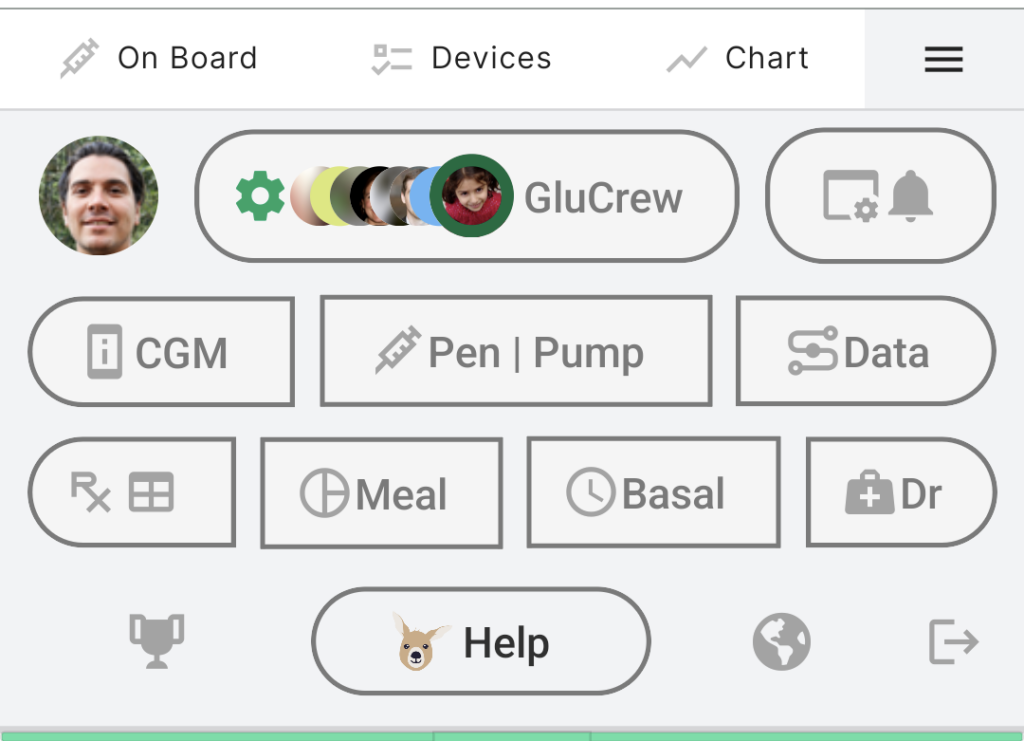
Menu Tray
This Tab is a menu to help you navigate all of the main screens of Gluroo when you’re logged in.
The top row is various settings from left to right: Your profile, your GluCrew and its settings including an ability to invite others to your GluCrew, and your per-user and this phone device settings.
The second row is various diabetes device and integration configurations and setup.
The third row is your Prescription including your Dosing Table, your mealtime Rx (Carb Ratio CR, Insulin Sensitivity Factor ISF, and target value) optionally split by times of day, your basal dose reminders (for long-acting insulin doses if you’re using a pen or a syringe), and integrations with your doctor or health care provider.
Finally, the last row of the menu tray provides access to the trophies page, the help and diagnostics screen, a community discussion forum (one per human language), and a sign out button (not typically needed).
Gluroo Event Log
The GEL is where all your diabetes management data and discussion goes so your whole GluCrew stays in sync. Gluroo works like a chat app, and better because it understands what you message each other and annotates every message with the Primary User’s current blood glucose level so you understand the context for the discussion and action.

Primary User (formerly Person with Diabetes or PWD)
Each GluCrew has exactly one Primary User and the chat log is focused on the data most relevant to their health and well-being. Anyone in the GluCrew including the Primary User can enter diabetes-related events as a message including insulin dosing, carbohydrate and other food intake, new devices starting, exercise, and other activity. The members of the GluCrew can also use it simply as a messaging tool to keep everyone in sync about the Primary User.

Others in the GluCrew (if any)
Gluroo supports Primary Users operating independently and is the best-in-class app for Diabetes logging even in that situation, but where Gluroo shines even brighter is in coordinating care of a Primary User among a team of family, friend, and supporting caregivers. All of those people come together to form a private “GluCrew” around the Primary User, jointly logging in the Gluroo Event Log (GEL) and chatting with each other, supporting and encouraging the Primary User. Research has proven that support like this leads to better diabetes management and overall well-being.

Devices and service integrations
The devices and services you connect to Gluroo can also post updates to the Gluroo Event Log (GEL) to keep your GluCrew informed of relevant activities. Some integrations such as the Omnipod 5 integration show extra real-time data specific to that integration in Gluroo’s header. Other integrations make Gluroo import data from Glooko, Apple HealthKit (iOS-only), and DIY Loop and other tools that write into Nightscout backends (via Gluroo Global Connect, a Nightscout-compatible backend provided to each GluCrew).

Glucaroo messages
Your friendly neighborhood Glucaroo is also a member of every GluCrew and occasionally there are helpful notices, tips, insights, and encouragement that the Glucaroo will provide. Note that Gluroo’s messages are never medical advice and Gluroo cannot be used for making medical decisions.

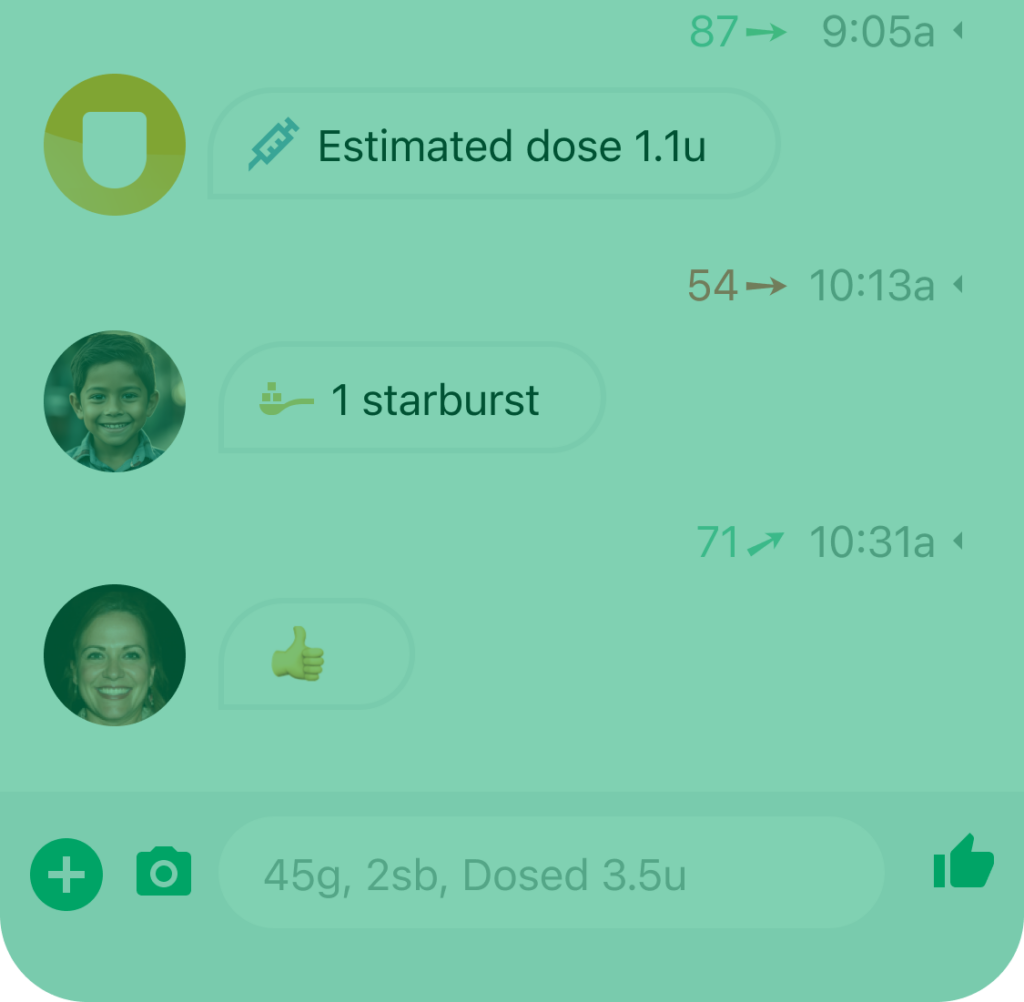
Sent messages
Messages can include words, emojis, photos, or even just a simple thumbs-up “Like”. Gluroo tries to make sense of the message using a natural language processing engine to understand if there’s a specific event the message is logging. You can also send a message by using the Plus button in the bottom left to use the tap-to-enter approach. See What Gluroo Understands for more details on what you can enter to log events — an event has an icon at the far left of the message inside the message bubble to indicate the type of message.
Insulin
A message that logs an insulin bolus or a basal dose of insulin shows a blue syringe icon at the far left (with a clock for basal doses) and includes the number of units of insulin as part of the message. When a new insulin bolus is recorded, the header’s IOB (Insulin On Board) will update, too.
Carbohydrates
A message that logs carbohydrates (not sugar) from a meal or snack shows a yellow fork and knife icon at the far left. It includes the number of grams of carbs (not the total number of grams of food) and optionally can include grams of fat and/or protein, too. You can include a description of the food to help everyone remember what it was, and Gluroo uses its best abilities to understand the likely food absorption speed of that meal. The header’s COB (Carbs on Board) updates when new carb messages are logged.
Intervention snacks
A message that logs a low-intervention snack shows a yellow spoonful of sugar icon at the far left. It includes a quantity of the intervention snack based on typical interventions used by the GluCrew. For example, “1 sb” means 1 starburst and is configured to mean 4g of fast-acting sugar. Gluroo knows that those sugar snacks absorb more quickly than carbs that are logged, and the decay curve for the COB due to sugar is much quicker, lasting just 30 minutes or so.
BG Annotations on each message
Every message in the GEL has a header—sometimes shared with other messages—that shows the time of the message and the then-current BG level and trend, if any. The triangle to the right of those headers allow you to open up an inline chart showing the BG trend around that time so you can see how a meal impacted blood sugar levels. Those charts are particularly useful when reviewing historical meals found via Search.

Day separators
The GEL is a continuous log of all the diabetes data and conversations, and there are separators at each midnight local time. The day separators stay sticky at the top-right of the GEL so you know what day the top-most messages are from. The day separators also show day summary statistics in pills to the left (total carbs and insulin) and below (time-in-range stats) the date.
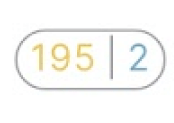
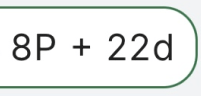
Total carbs and total insulin on that day
At the far left of day separators is a pill showing total carbs on that day (in yellow on the left) and total insulin on that day (in blue on the right). Remember to always use a first party app (e.g., the Omnipod 5 app itself) for accurate totals since Gluroo may not be a complete log and may not be used for making medical decisions.
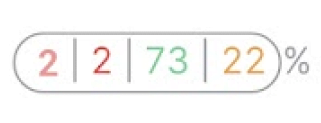
Time in Range (TIR) on that day
Underneath the day separator is a pill showing percentages of the day with blood glucose in various ranges. From left to right, the ranges are Extreme Low (red), Low (different red), In-Range (green), and Above Range (orange). See the TIR section above for the absolute ranges for each of those.

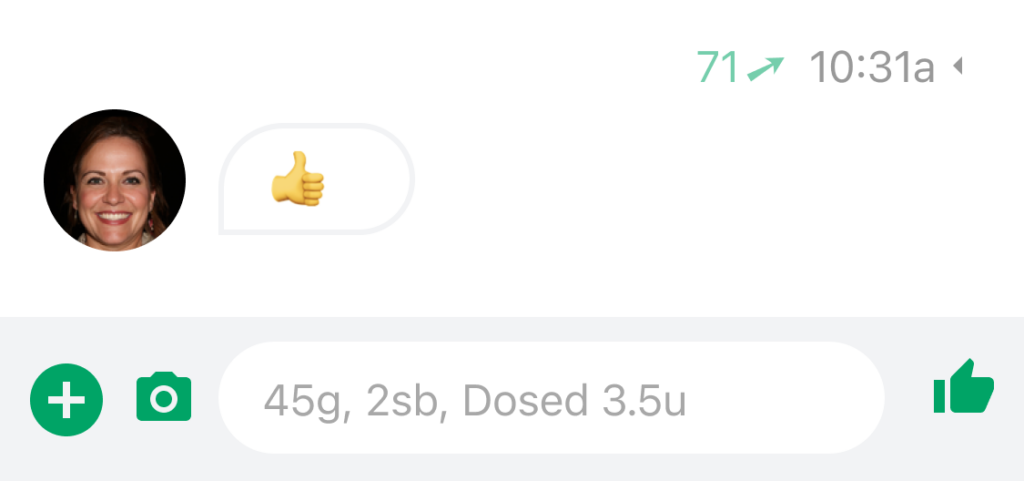
Plus quick add button
The green plus button at the bottom left of the chat GEL allows you to use a couple taps to quickly log insulin doses, meals, intervention snacks, exercise, finger-prick glucometer readings, new devices, and more. The Plus button will morph into a cancel “X” button to close any bottom-of-screen response tray that is open.

Camera quick photo button
The green camera button just to the right of the Plus Quick Add Button opens a camera view and lets you scan a QR code to log a new device or take a photo of your meal, a nutrition label, exercise location, or whatever helps document the Primary User’s diabetes journey. After taking a photo, Gluroo’s AI will suggest tags to make it easy and fast to also include details about what the photo includes for future searching and for others to read.

Like (thumbs up) button
The green like button on the bottom right of the chat GEL lets you quickly respond to new data, a recent event, or someone’s recent message.
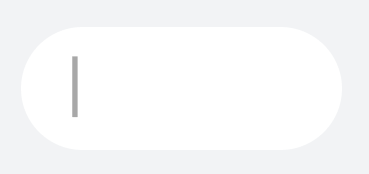
Message entry
The white text field at the bottom of the chat GEL allows you to send messages to the GluCrew and log diabetes data. With Gluroo, our NLP engine is always trying to make sense of your messages to turn them into structured data that can be used to help understand the diabetes data that can be most useful to you. As you are typing, icons show at the far right of the message entry area to let you know when a structured message type is understood or when Gluroo recognizes that you’re entering a time modifier to log an event in the past or the future. For example, in the morning while packing lunch, you might send a message “45g PB&J sandwich at 12:25pm” to remind the PWD of what their lunch is and how many grams of carbs to enter into their PDM for that mealtime Bolus. Gluroo will remind the PWD to pre-bolus for meal events entered in the future.