CGM stands for Continuous Glucose Monitoring. It means measuring the blood glucose continually, 24 hours a day for several days.
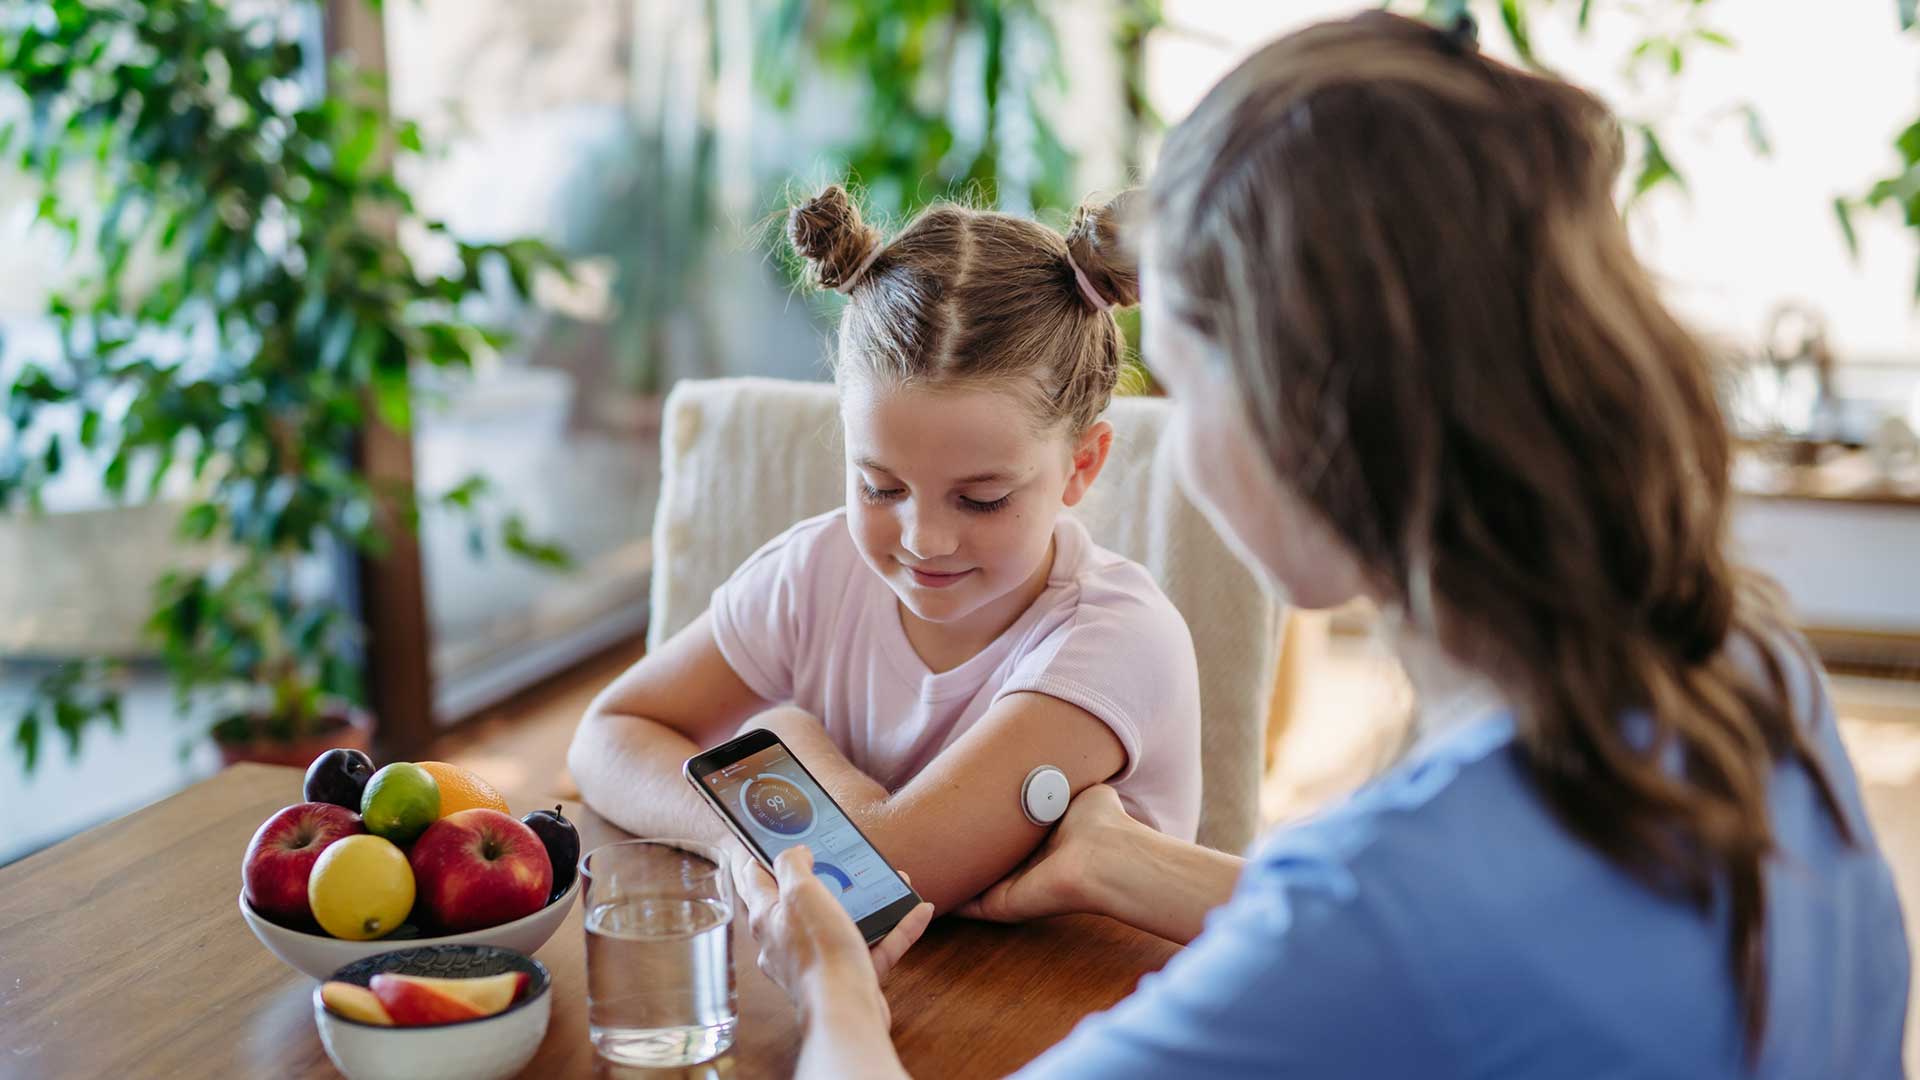
If you are reading this article, most likely, your child is living with diabetes or was recently diagnosed with it.
And your child’s doctor may have recommended you use a CGM device to measure blood glucose levels. But these devices can be a bit confusing because they provide a lot of information and data.
If you struggle to make sense of all those figures shown in the device’s app, this post is for you. By the end of it, you will understand how to interpret all of the data provided by a CGM.
Why Use a CGM Device?
Doctors tend to prefer a CGM because it provides an abundance of information. By looking at CGM data, doctors can see the factors affecting blood glucose levels during the day, like medication, exercise, food intake, etc. This allows them to provide better care for your child.
CGMs are also great for diabetes patients and their caretakers because it lets them know immediately if blood glucose levels get too high or too low.
Also, CGMs help identify the correct dose of insulin needed at a specific time which may come in handy if your child doesn’t use an insulin pump.
A CGM device is great because it provides much more information than other lab tests or home glucometers. This is why it’s important to know what kind of information it provides so you’ll know how to best help your child manage his/her diabetes.
Now that you understand CGMs a bit better and how they work, let’s understand how blood sugar levels are measured.
How Are Blood Sugar Levels Measured?
Before we move on to understanding CGM, it is vital to understand how blood glucose is typically measured.
For day-to-day monitoring of blood glucose levels, you have two options. You can use a quick finger-prick test or you can use a CGM device.
The main difference between the two is the frequency of measuring. With the finger-prick test you decide when to measure your levels and how many times a day. With the CGM you have your glucose data available to you at all times without needing to prick your finger.
A child living with diabetes will typically have blood glucose levels, on average, around 126 mg/dl.
For long-term monitoring, there is the A1C test. This will have to be performed by a nurse or doctor and it provides the average blood glucose level for the last 60-90 days.
This test shows how well a person controls diabetes in the long run. It’s important to note that higher ranges of A1C (above 7%) can be linked to diabetes-related complications. Maintaining an A1C of 7% or below is essential for children with diabetes.
Know Your Child’s Healthy Range
As already mentioned, values of blood glucose levels of 126 mg/dl are generally accepted as normal. However, those are values for healthy children after fasting.
For kids living with diabetes, 140 mg/dl (fasting) and up to 180 mg/dl after meals are typically good. This article from Healthline shows the recommended blood sugar level ranges for children with type 1 diabetes.
As you get used to managing your child’s diabetes, you’ll start to learn what his/her healthy ranges are and what levels to look for throughout the day. You’ll also learn how these levels are affected by medication, food, exercise, and other factors.
Let’s dive into the real purpose of this post and start going through the data provided by the CGM.


Main CGM Metrics and Data
When blood glucose is monitored continuously it provides a lot of data, unlike other blood tests that provide a single value. That is why interpreting the data may pose a challenge.
Below are some of the most important metrics and what they mean. This will let you know how to interpret CGM results and what the numbers on the glucose meter mean.
Average Blood Glucose
When it comes to CGMs, studies show that they provide highly reliable results when the blood glucose is monitored continually for 14 days. For this reason, most CGM studies are done for 14 days.
Average blood glucose, as the name states, is the average level of blood glucose during the monitoring period (usually 14 days). These values are generally very close to A1C test values.
Time-in-range (TIR)
This is the single most important metric provided by the CGM, and it’s the one you should pay the most attention to.
Blood glucose levels change constantly during the day. TIR is the amount of time that blood glucose remains within the normal range of 70–180 mg/dl. Any values above or below these indicate high or low blood glucose.
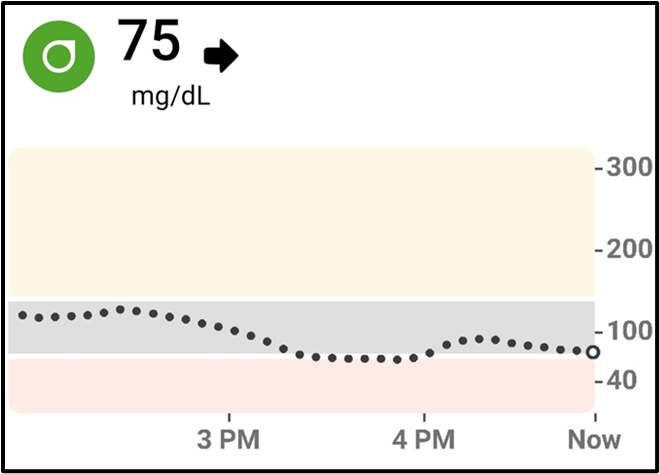
The image below is a screenshot of the Dexcom G6 app that helps to visualize the ranges. The gray area is “in range” (70-180 mg/dL), the red area is “low”, and the yellow area is “high”.
By inspecting the points in the image below, we can see that this person has spent most of their time “in range” with a few points in the “low” range. We can even count them up and calculate the TIR manually. There are 36 data points, of which roughly 7 are “low”. This gives us an 80% time in range (29 / 36 = 0.806) over this specific period of time.
Remember that TIR can be calculated over any time period, but it is usually reported over 1, 7, 14, 30, or 90 days.
Since blood glucose levels are not constant and increase significantly after meals, most people should have a target TIR of 70%. This means that for 70% of the time, blood glucose levels must remain within the normal range of 70–180 mg/dl.
Trend Arrows
As the name suggests, it shows the trend of blood glucose level, and whether it’s stable, going up or down.


This is based on the readings of the previous 15 minutes. Studies suggest that this metric’s good for predicting blood glucose rise or decline for the next 30 to 60 minutes. You can use this information to help you decide the correct amount of bolus insulin to dose for a correction.
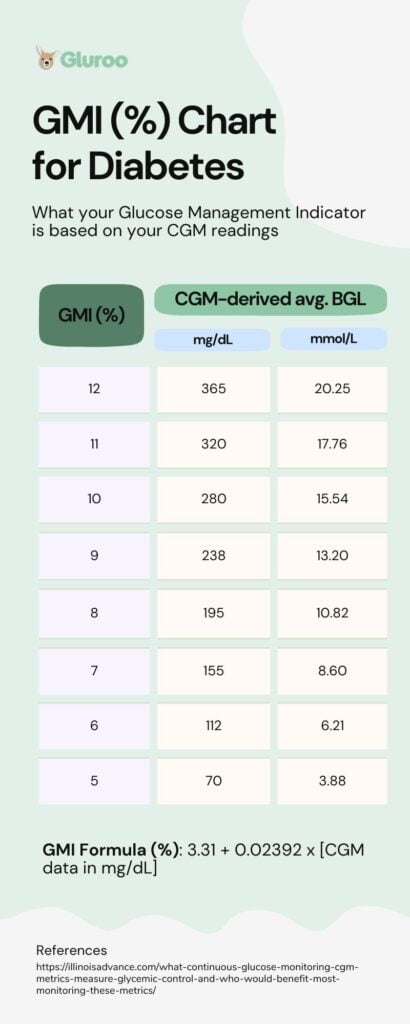
Glucose Management Indicator (GMI)
As already mentioned, CGMs provide average blood glucose levels roughly equal to A1C values. Therefore, many early CGM systems used to mention, and some even continue to mention, the estimated A1C.
But, A1C calculated based on the average blood glucose levels doesn’t usually coincide with the A1C lab test values, which creates a lot of confusion for patients/parents/caregivers.
Therefore, instead of using A1C, CGM systems now use the term GMI. This is almost the same thing as A1C but measured differently, thus giving slightly different results compared to laboratory A1C.
As we’ve seen before it’s important to maintain lower levels of A1C or GMI to prevent complications related to diabetes.
Understanding CGM Reports
Now, we’ll look at a real-life example of what the CGM report looks like.
It’s important to understand that visual reports from different CGM manufacturers can look different, but they all contain roughly the same elements.
Ambulatory Glucose Profile

At the bottom of the report, you’ll find a graph in blue (see picture above) that shows your child’s blood glucose patterns throughout the day (based on data from several days). From this you can see what times of the day the glucose levels vary the most and are too low or too high.
For example, this person spends more than 50% of their time from 12PM to 12AM in the “high” range. Note in the top that the data is averaged over 15 days.
By identifying these patterns, you’ll be able to better manage your child’s diabetes throughout the day, so this report can be extremely useful.
Also note that this report includes two metrics that we haven’t discussed yet: standard deviation (SD) and coefficient of variation (CV).
SD is the variation or deviation from the average blood glucose levels. A lower SD means steadier glucose levels without much deviation throughout the day.
On the other hand, a higher deviation indicates poor blood glucose level control and a higher risk of complications. So, for example, if your child consumes a diet high in fast-absorbing carbs or uses lower bolus insulin, they may have a high SD.
CV is basically a coefficient calculated from SD (divide the SD by the average blood glucose and multiply by 100). For healthy children, a maximum of 25% CV is good. Just like SD, a higher CV indicates fluctuations in blood glucose levels and a higher risk of diabetes complications.
CGMs Make Diabetes Management a Little Simpler
As you can see, CGMs provide a lot of information. They can be especially good for understanding why your child is failing to control blood glucose levels (if that’s the case) or have a higher A1C.
This can ultimately help make lifestyle changes and streamline insulin treatment. And as a parent of a child with diabetes, all of this data readily available can help make diabetes management a little bit simpler.
Another tool that can streamline your child’s diabetes management is Gluroo, our collaborative diabetes management app.
It connects with your child’s CGM and insulin pump and allows multiple caretakers to be involved in the daily management of your child’s diabetes. Logging more information (time and size of meals and insulin boluses, exercise, snacks for low blood sugar, etc.) will help you and your doctor pinpoint problem areas, and Gluroo makes logging these types of things very easy.
You can learn more about Gluroo here on our website or download it today for free!
